Krill, Sea Ice and Predators: Follow the Connections Carefully
Why a food-web diagram is useful—and why it cannot substitute for population monitoring.
A small animal with several ecological roles
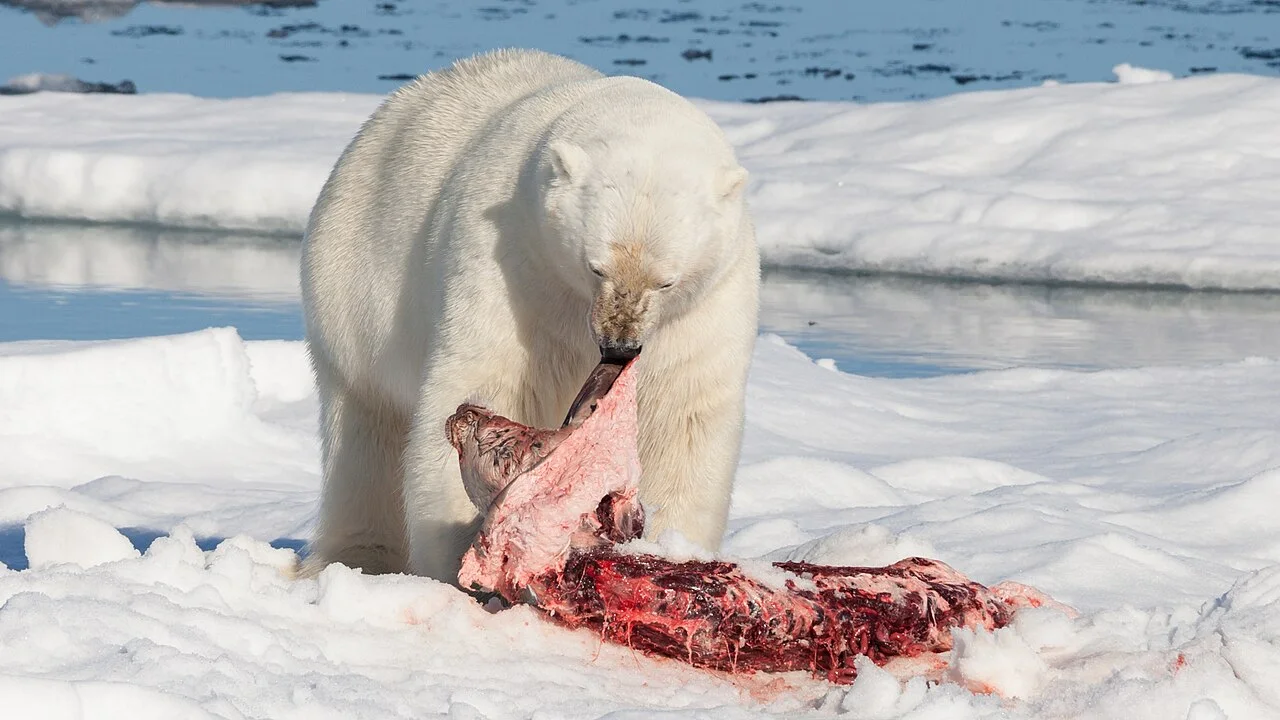
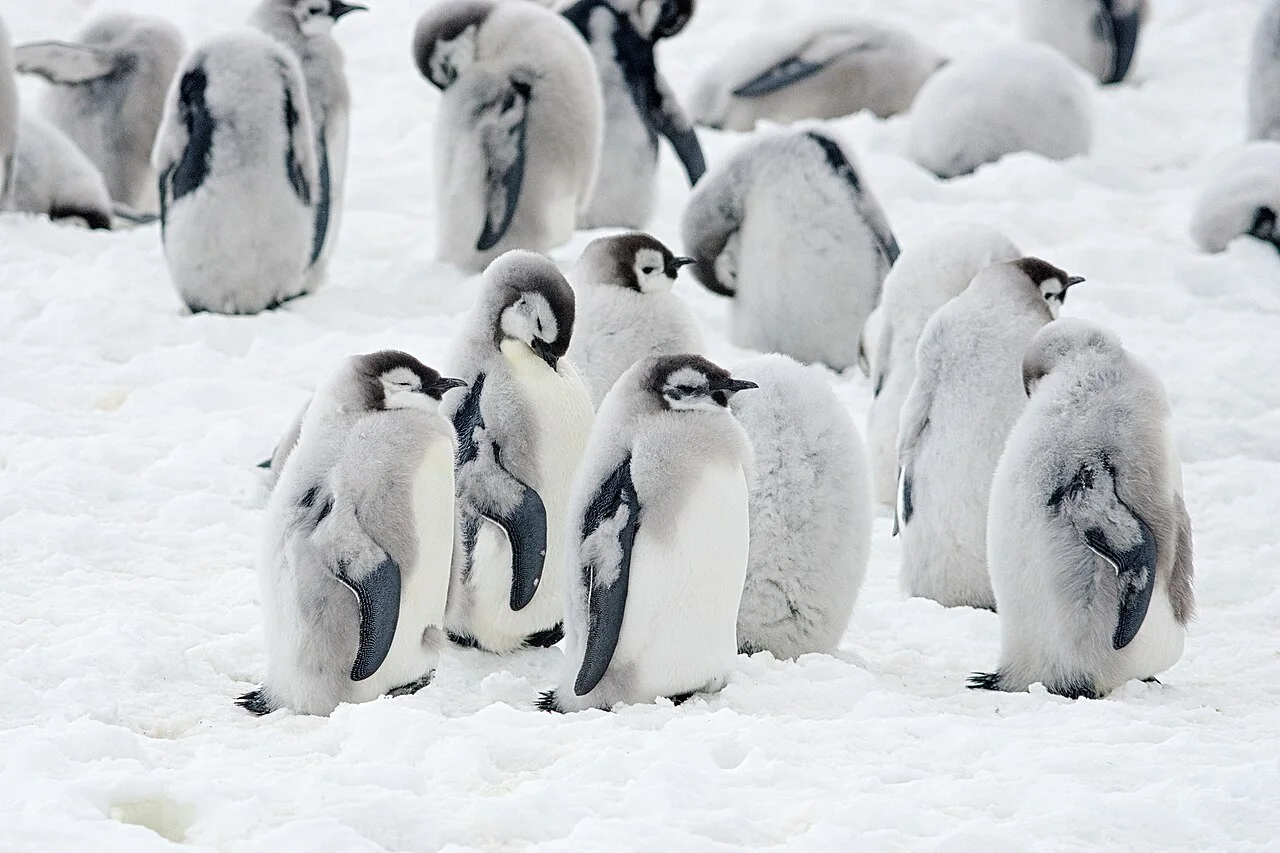
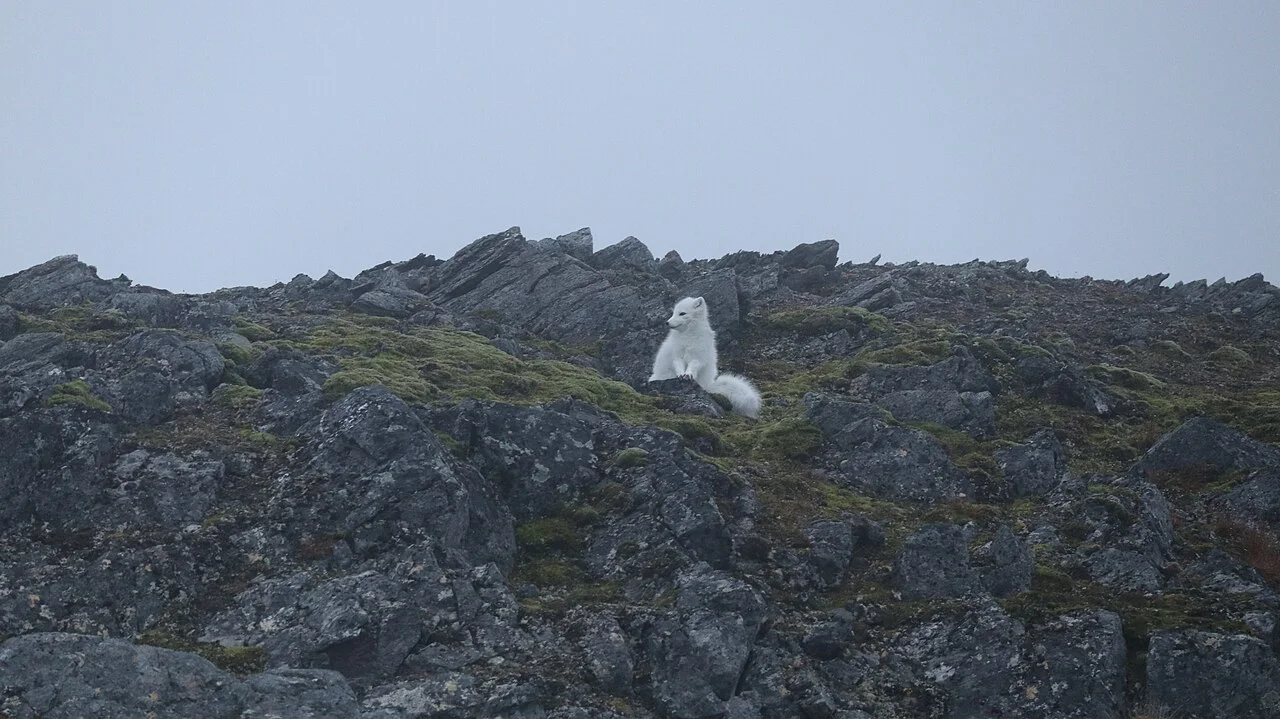
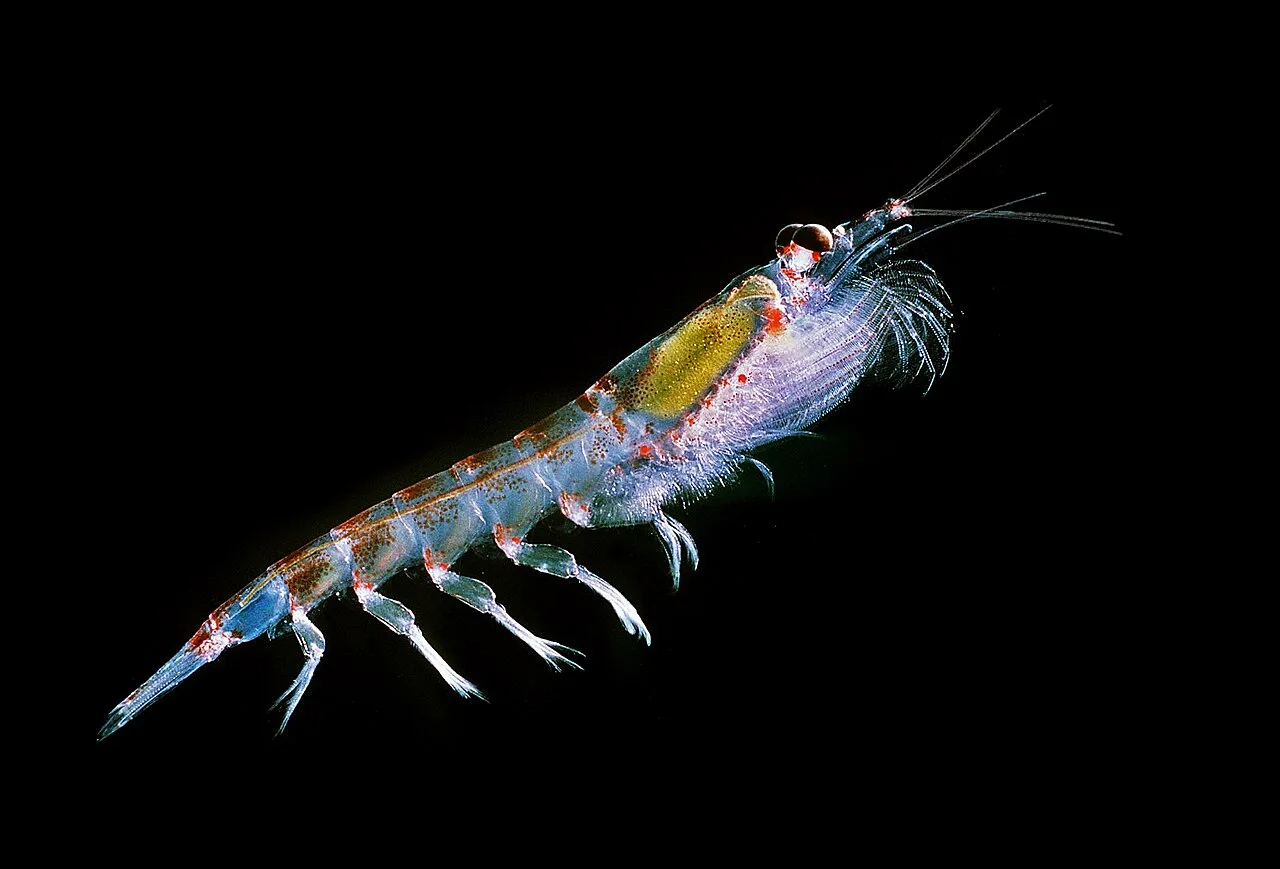
Antarctic krill are crustaceans that feed on small organisms and provide food for many larger animals. A diagram placing krill between primary producers and predators captures an important connection, but a real food web contains alternative prey, seasonal changes and geographic differences.
Calling krill the only foundation of every Southern Ocean ecosystem goes too far. The more useful task is to identify which predator, life stage, season and location a particular study describes.
Ice can affect food as well as shelter
Sea-ice conditions influence the habitats and food available to organisms associated with the ice. The timing of ice formation, retreat and biological production can therefore matter alongside the total area of ice. A large annual number may miss a mismatch between food availability and the needs of a particular life stage.
This explains why an ice-extent chart is ecological context rather than a direct krill census. To establish a change in abundance, researchers need observations suited to krill and an account of how those observations were sampled.
Fishing and climate questions need different evidence
A local overlap between a fishery and predator feeding grounds raises a spatial management question. A broad environmental change raises another question about habitat and productivity. Their effects can interact, but the presence of one does not make evidence for the other unnecessary.
When reading a conservation proposal, ask which objective it serves and what observations could test that objective. The Antarctic Treaty Secretariat explains CCAMLR's ecosystem approach: harvesting decisions must consider effects beyond the target resource. This framework helps distinguish a food-web illustration, a stock observation and a management decision instead of merging all three into a single dramatic claim.
Follow the life-cycle transcript rather than one food-web arrow
The Australian Antarctic Program's krill page includes a life-cycle transcript describing young krill feeding on algae beneath sea ice. Use this specific link to explain why timing matters. The relevant connection is between a life stage, a feeding opportunity and its environment. It is more precise than saying all krill simply depend on the annual maximum ice area.
Draw the young-krill feeding link separately from the predator link. The first concerns resources available to krill; the second concerns krill available to other animals. A change in one may influence the other, but a regional ice chart does not directly measure either population. The practical reading result is a food web with named mechanisms. To assess an actual decline, seek the survey method and sampling period, then connect those observations to the stage-specific explanation rather than substituting the diagram for a census.
Abundance, biomass and local availability differ
A count concerns the number of animals; biomass concerns their combined mass. Availability to a predator also depends on where the animals occur and whether that predator can reach them when it needs food. These quantities are related, but none is an automatic substitute for the others. The same broad biomass could be distributed in ways that create different feeding opportunities around a particular colony.
Imagine two fictional maps containing the same total amount of krill. One concentrates much of it within a predator's usable feeding area; the other places most beyond that area. The total has not changed, but the local ecological question has. This example does not establish an actual shortage. It shows why a claim about a colony needs spatial and seasonal evidence alongside any ocean-wide number.
Match the sampling method to the claim
Before comparing survey results, identify what was measured, where sampling occurred and how the observations were converted into an estimate. A sample collected at a station represents a specific observation under specific conditions. Extrapolating to a much larger region requires a sampling design and assumptions. A good explanation states those assumptions in accessible language instead of treating an estimated total as a direct count of every animal.
The dates matter too. A result from one season should not be described as a permanent map of supply. When two estimates differ, possible explanations include biological change, different coverage or different methods. Those alternatives should be investigated rather than choosing the most dramatic interpretation immediately. Readers can ask whether the surveys were designed to be comparable before treating their difference as a measured trend.
Read an ecosystem decision as a question of objectives
The ecosystem approach described through the Antarctic Treaty system recognizes that a harvested resource is connected to other parts of the ecosystem. To evaluate a particular proposal, first identify its objective: protecting a feeding area, limiting removals, improving monitoring or addressing another defined concern. A broad statement that conservation is needed does not explain which outcome a specific measure is intended to achieve.
Then ask what observation would indicate progress and what uncertainty remains. A measure can be precautionary without pretending that every interaction has already been quantified. Conversely, the presence of uncertainty does not mean there are no relevant observations. This way of reading management accounts keeps the reasoning visible while avoiding an unsupported promise that any one action will determine all future predator outcomes.
Put an environmental chart beside a biological observation
A useful comparison pairs an environmental series with a biological measure from a compatible place and period. Begin by checking the dates, units and geographic boundaries. If those do not align, explain the mismatch before proposing a relationship. A circumpolar ice total and a local predator observation can provide context, but their different scales limit the strength of a direct comparison.
The reader's task is to follow the chain without skipping its links: environmental conditions can affect habitat and production; krill observations describe the resource; predator observations describe another response; management choices address defined objectives. Keeping those links separate makes it possible to understand how they interact. It also reveals exactly where another measurement would improve an explanation rather than merely adding another alarming headline.
Test a proposed shortage explanation
Suppose a fictional predator colony has a poor breeding season while a regional krill estimate remains similar. These observations are not automatically contradictory. The estimate might cover a different feeding area or period, and breeding outcomes can involve more than prey quantity. A useful investigation checks those connections before deciding that either observation must be wrong.
Write the proposed explanation as a chain of statements and attach an observation to each. Where a link lacks evidence, label it as a hypothesis. This makes the next research question visible and keeps a broad food-web diagram from becoming a complete diagnosis.