West Antarctica in Six Connected Parts
A practical map of bedrock, grounded ice, the grounding zone, shelves, ocean and snowfall.
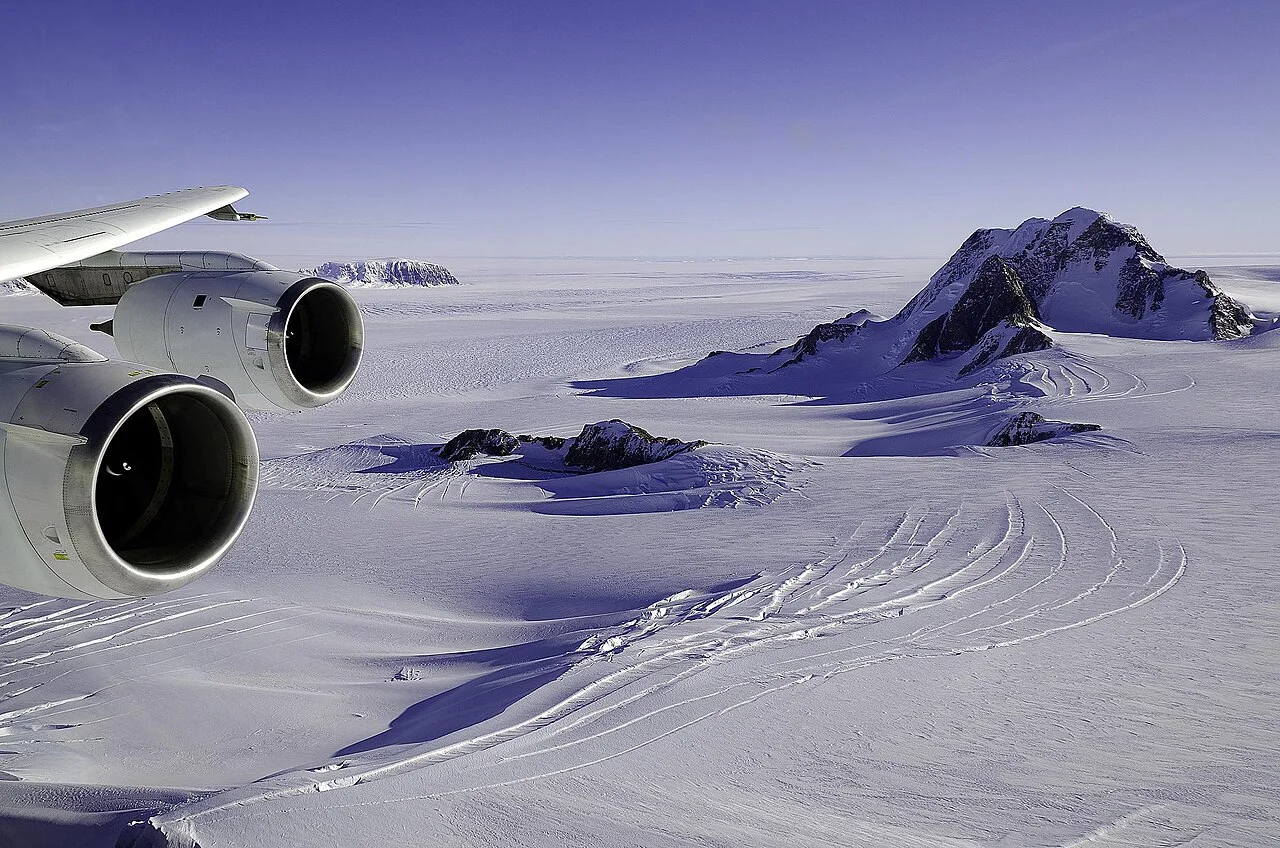
1–2: The bed and the grounded ice
The first part of the system is the landscape beneath the ice. Bed elevation and shape influence how ice can move and where seawater can interact with its margins. The second is grounded ice: ice whose weight is supported by the bed. Its thickness and flow cannot be inferred simply from the elevation of the visible white surface.
These are connected but different quantities. Surface thinning may reflect changes in snowfall, surface processes, flow or several mechanisms together. A reader needs the study's actual measurements before choosing among them.
3–4: The grounding zone and floating shelf
The grounding zone connects grounded and floating ice. The ice shelf is the extension supported mainly by seawater. Keeping the two distinct explains why the loss of floating ice can influence the flow of ice upstream without being identical to adding the same mass of grounded ice directly to the ocean.
A shelf can provide mechanical resistance through its geometry and contact with surrounding features. How much that matters varies by setting. The phrase ice-shelf collapse describes a visible change; a prediction of the response behind it requires additional evidence.
5–6: Ocean heat and the surface supply
The ocean can deliver heat to submerged ice, while snowfall and surface processes affect the supply and loss of mass from above. These sixth and fifth components belong to the same budget but are measured differently. An ocean-temperature record, a surface-melt map and a satellite elevation change are not alternative names for one observation.
Use this six-part framework to locate a claim before evaluating it. Does a study concern the bed, flow, grounding position, shelf, ocean or surface budget? Which connections did it actually measure, and which did it model? This is a system map, not a prediction of a collapse date or a claim that every part of West Antarctica responds uniformly.
Turn NSIDC's flow explanation into a labeled system map
NSIDC explains ice-sheet flow through surface slope, ice thickness and the ability to slide at the bed. Place these on a cross-section instead of treating the white surface as the entire system. This provides a physical answer to why the visible height alone cannot explain motion: thickness and the bed connection also enter the mechanism.
Now attach a hypothetical observation to the appropriate label. A surface-elevation change belongs above the ice; a mapped grounding transition belongs at the margin; an ocean record belongs in the water. None is a substitute for all the others. For a real West Antarctic study, identify which of these was observed and which links were modeled. The system map helps readers understand the scope of the finding without supplying an invented collapse date or assuming that every outlet responds identically to a change at the coast.
Separate an inventory from a rate
Ice volume describes an amount present within a boundary. Mass change describes a difference over time. Flow speed describes movement, while acceleration describes a change in that movement. A story can mention all four without measuring the same thing four times. Check units first: an amount, an annual change and a speed require different interpretations and cannot be substituted directly in a calculation.
For a fictional example, imagine an outlet moving faster while its snowfall supply also changes. Speed alone does not supply the complete mass budget. To assess the balance, the analysis must account for gains and losses within a defined region and period. The example explains why a striking flow map should not automatically be translated into a whole-ice-sheet loss rate or a calendar date for a future outcome.
Why floating ice can matter upstream
Floating shelf ice and grounded ice have different relationships to seawater, yet they remain mechanically connected. The useful question is how the shelf's geometry and contact with surrounding features affect resistance to flow. Removing an extension from a drawing is not enough to quantify the response. The setting determines which connections matter and how a model represents them.
This avoids two opposite shortcuts: treating floating ice loss as identical to the same mass entering from land, or deciding that floating ice is irrelevant because it already displaces water. A responsible explanation identifies the direct change and the possible effect on grounded ice separately. Readers can then ask which observations support the connection instead of choosing between two oversimplified slogans.
Read a model result through its assumptions
A model explores how a represented system responds under specified conditions. Before repeating a projected result, identify the scenario, starting state, processes represented and period covered. A conditional outcome is not a dated appointment with the future. The model can reveal important sensitivity even when uncertainty remains about the conditions that will actually occur.
Compare studies by their questions as well as their headline numbers. One might isolate the response of an outlet, while another estimates a regional contribution under a scenario. Different domains and assumptions can explain different outcomes. A useful article tells the reader what was held fixed, what was allowed to change and which uncertainty the experiment was designed to investigate.
Use the six parts to diagnose a headline
Take the fictional claim warmer water causes ice loss and divide it into testable links. What water was measured, where was it measured, how could it reach the ice, and what ice response was observed? Then check the surface supply and flow information. This does not require proving every connection from one paper, but it does require showing where supporting evidence enters the argument.
End a reading note with three lines: the observed change, the supported explanation and the remaining uncertainty. That note is useful for a student comparing diagrams, a reader evaluating a news report or a teacher explaining why the system cannot be reduced to one photograph. West Antarctica becomes intelligible as connected components whose responses must be measured and modeled at the relevant scale.
A final map-reading check
On a real figure, locate the study boundary before following any arrows. If only one outlet is highlighted, retain that scale in your summary. If color represents elevation change, do not relabel it as ice speed. If a shelf outline changes between dates, distinguish that mapped boundary from a measured change in grounded mass. These small caption checks make the six-part model practical: each symbol now has a physical meaning and a defined evidential limit rather than serving as a general sign of change.