What a Retreating Grounding Line Actually Measures
Distinguish a glacier's grounding line from its ice front, and understand why the bed underneath matters.
A boundary under the ice
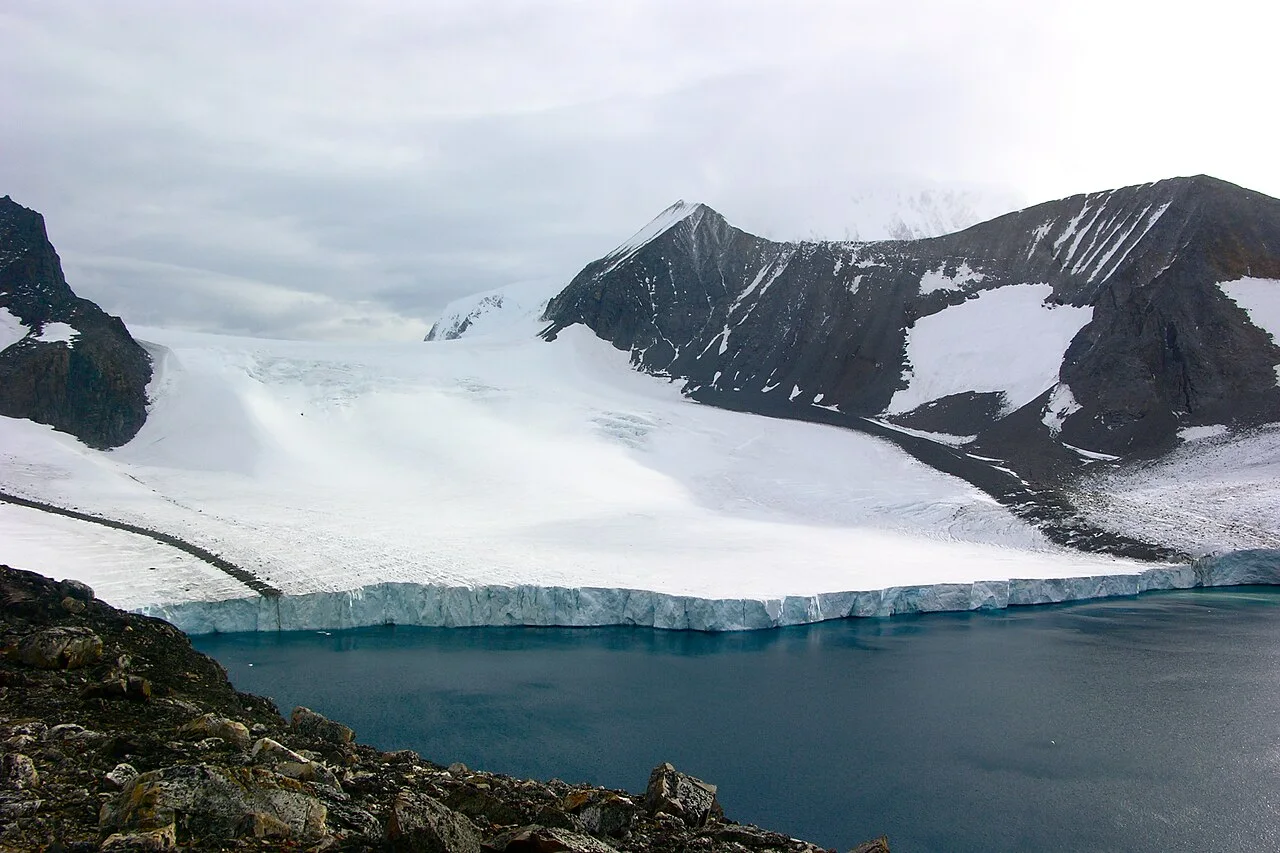
The grounding line marks the transition between ice resting on its bed and ice floating in seawater. It is not the same as the visible front where icebergs break away. A photograph of an ice cliff may show the front clearly while providing little information about where the glacier stops being supported by the bed.
This distinction matters when interpreting Thwaites stories. Front retreat, grounding-line retreat, thinning and acceleration are related observations, but they use different measurements. Our previous claim of a new 1.2-kilometer retreat lacked a traceable study and measurement interval and has been removed.
Why retreat can change the system
An ice shelf is already floating, but it can influence how grounded ice flows toward the sea. Its mechanical interaction with the glacier and surrounding terrain can provide resistance. Changes to shelf thickness or contact points may therefore matter even though melting floating ice is not equivalent to adding an equal mass of new land ice to the ocean.
The bed's geometry also affects the response. A retreat into deeper water can produce different behavior from retreat across a shallower or stabilizing feature. That is a reason to examine a specific glacier's measurements and models, not a rule that every stretch of grounding line must retreat at a constant rate.
Four details to demand from a retreat figure
Ask what boundary was mapped, which dates were compared, what spatial uncertainty applies and whether the reported distance is local or averaged across a wider front. Dividing a distance by a time interval can describe an average; it does not prove that the movement was steady or that the next interval will match it.
A useful news account connects those measurements to a physical explanation and states what remains uncertain. A dramatic nickname contributes neither. This page explains the measurement vocabulary; it supplies no new Thwaites survey result or sea-level deadline.
Use a cross-section rather than only a map
A simple imagined cross-section helps organize the terminology. Picture ice moving from an inland bed toward the coast. At one point it begins to float; farther seaward its front can break into icebergs. The distance between these features is not fixed, and their movements need not be identical. Marking both on the drawing immediately shows why retreat at the calving front cannot be substituted for retreat at the grounding line.
Add the bed beneath the drawing and seawater beside the floating part. You can now ask where heat might reach submerged ice and where the floating extension interacts mechanically with its surroundings. The drawing is a conceptual aid, not a model of Thwaites or a calculation of future loss. Its value is that it exposes the missing pieces in a verbal explanation: a headline about one boundary should not silently claim to have measured all the others.
A retreat distance needs a measurement interval
Suppose a study compares mapped positions from two observation periods and reports a local separation. That separation describes the change between those observations, within the method's uncertainty. It does not reveal every movement between them. Dividing by elapsed years produces an average rate for that interval; calling it the present annual rate would add an assumption about steadiness that the two endpoints alone cannot establish.
Spatial averaging introduces another choice. A glacier margin may change unevenly across its width. A number describing the greatest local retreat should not be presented as the average retreat of the whole boundary. Conversely, an average may conceal local differences relevant to the physical explanation. Ask which statistic was used and why. The reader does not need to reproduce the remote-sensing analysis to recognize that a maximum, a mean and a mapped example are not interchangeable.
Separate observations from projections
An observation describes a measured state or change; a projection explores what a model produces under specified assumptions. Both can be scientifically useful. Problems arise when an article introduces a projected outcome as an already observed event or treats one conditional experiment as a scheduled future. Look for the forcing assumptions, time horizon and uncertainty attached to a projection before interpreting the number as a forecast.
Similarly, a physical feedback identifies a mechanism that can reinforce change under particular conditions. It is not a stopwatch. Evidence that a glacier is vulnerable does not by itself specify the year when a particular consequence will occur. A responsible account can explain why researchers are concerned while resisting the temptation to attach an unsupported deadline. That balance is especially important for a widely discussed glacier whose nickname can overwhelm the details of the actual study.
Build a more useful glacier headline
A reader-centered headline should identify the feature and the kind of evidence. An article about new mapping can explain how the mapped grounding zone differs from the visible front. An article about a model can identify the scenario and what the experiment was designed to test. Those are different stories, even if both concern the same glacier. Trying to compress them into one catastrophe claim makes the article less informative.
Before relying on a retreat figure, write down four fields: boundary, dates, spatial statistic and uncertainty. Then add the proposed physical explanation separately. If the article cannot supply the first four, seek the original paper or data description. If the explanation goes beyond them, label it as interpretation. This habit makes a technical glacier report accessible without replacing its actual evidence with an impressive but untraceable distance.
Annotate the ice-sheet cross-section before using a retreat number
Use NSIDC's ice-sheet explanation to draw a bed, grounded ice and its floating extension. Mark the transition separately from the seaward front. Now ask where a reported retreat distance belongs. A mapped front can move while the grounding position is assessed through different observations. Naming the boundary is therefore necessary before deciding what the distance tells us about a glacier.
For a Thwaites report, write the boundary, observation dates and measurement method beside the number. If the paper concerns elevation or velocity instead, keep those quantities on separate lines rather than translating them into retreat. The cross-section supplies a physical explanation, not new Thwaites measurements. It lets readers understand why two real studies can report different changes without contradicting one another, and why a claim about future inland response needs more evidence than an unlabeled edge on a satellite image.