How to Read a Western Hudson Bay Polar Bear Estimate
Survey year, uncertainty and method explain more than an isolated population headline.
An estimate belongs to a survey
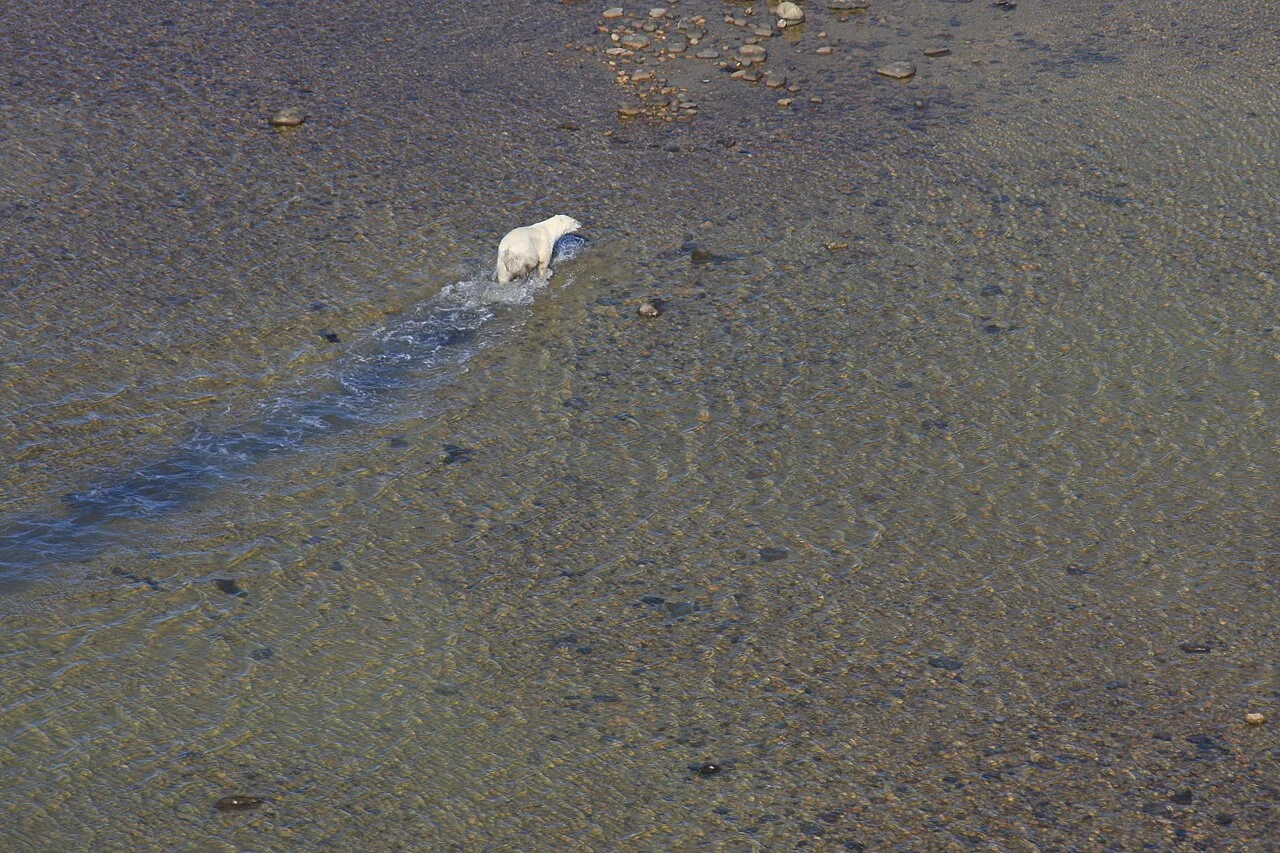
A population estimate is not a live counter. Polar Bears International's explanation of the Western Hudson Bay aerial survey reports an estimate of 618 bears for 2021 and describes a substantial decline from the comparable 2016 survey. The survey year should travel with the number whenever it is quoted.
Our earlier claim of a new 2026 count of 570 had no supporting survey citation and has been removed. The dated figure discussed here should not be relabeled as today's population or extrapolated mechanically into a new total.
Compare methods before calculating change
Aerial surveys and capture-based studies do not observe animals in identical ways. Detection, sampled area and analytical assumptions affect an estimate and its uncertainty. The source explicitly cautions against treating older estimates obtained with a different method as directly interchangeable.
That does not make long-term evidence meaningless. It means that the strongest comparisons identify the method, geographic population and uncertainty instead of presenting a chain of integers as though every bear had been counted in the same way.
Why sea ice is part of the interpretation
Polar bears depend on marine prey and use sea ice as a hunting platform. In a seasonal-ice system, changes in the time available for feeding can affect body condition and reproduction. Different ages and sexes can be affected differently, so total abundance is only one part of the ecological picture.
A useful summary therefore pairs the population estimate with evidence about the population's habitat and demography. It does not convert a regional estimate into a statement about every polar bear across the Arctic. Nor does it imply that one season's ice conditions explain all changes between surveys. When a newer assessment is published, compare its actual methods and interval before replacing the dated figure.
Trace the survey years in the published interpretation
Polar Bears International's January 2023 interpretation identifies aerial surveys in 2011, 2016 and 2021 and emphasizes comparable techniques. Use those dates to construct the comparison before quoting an estimate. The publication date identifies the account; the survey year identifies the population observation. Updating this website cannot turn that older observation into a fresh census.
Then identify Western Hudson Bay as the population under discussion. The reported comparison concerns that regional survey system, not a simultaneous enumeration of every polar bear across the Arctic. A useful summary names the region and survey year before giving the result and distinguishes the estimate from an exact count of visible animals. Readers can use this order to detect a common misleading update: an old number retained beneath a new year without new field evidence. The underlying study and its uncertainty remain necessary for a fuller statistical assessment.
A numerical exercise exposes false precision
Consider a fictional survey estimating 600 animals in one year and 650 in a later year. The difference between the central estimates is 50, but the reader still needs their uncertainty and comparability before declaring a clear increase. The example does not describe an actual Hudson Bay assessment. It shows why arithmetic alone cannot decide how confidently two survey results differ.
A percentage can create another misleading impression. A change calculated from two central estimates may be a useful summary, yet it is not a count of identified individuals that disappeared or appeared. Methods, detection and uncertainty remain relevant after the calculation. If an article supplies a percentage but no survey years or methods, the numerical appearance of precision is stronger than the evidence the article has actually provided.
Use biology to interpret, not to replace, the survey
Knowledge that polar bears use sea ice to hunt seals helps explain why the timing of access to ice matters. It does not manufacture an abundance estimate for a year without a survey. Likewise, an observed change in body condition may be important without providing a substitute count. Different measurements contribute to a biological explanation precisely because they describe different aspects of the population.
Demographic information can show whether changes are concentrated in particular ages or sexes. That makes the interpretation more informative than a single total. However, an article should not infer those details merely from a decline in the total number. Look for the actual breakdown and the authors' assessment. Connecting evidence requires respecting what each observation measured, not simply placing several concerning facts in the same paragraph.
A responsible update keeps the old evidence visible
If a newer assessment becomes available, do not erase the survey year of the earlier result and retain its number under a fresh date. Explain what the new work adds, whether its methods are comparable and which conclusions change. This allows a reader to understand an evolving evidence base rather than mistake a website update for a newly completed aerial survey.
For a useful short summary, name the population, survey year and method before giving the estimate. Add the relevant comparison with its limitations, then explain the habitat connection separately. Readers can then distinguish measured abundance, observed condition and ecological interpretation. That structure gives a conservation story more value than an isolated number, while avoiding unsupported claims that one regional result describes every polar bear population or determines a precise future outcome.
Interpret a number alongside its scientific purpose
Different studies can be designed to estimate abundance, survival, reproduction, movement or condition. A reader should ask which purpose drove the sampling before expecting one study to answer all the others. A carefully measured body-condition result can reveal a serious concern even if it does not provide a new abundance estimate. Conversely, an abundance survey may not explain every mechanism behind a change.
Imagine preparing a classroom slide. Put the survey result in one box, the comparable earlier survey in a second and the ecological explanation in a third. Label any connection between the boxes as measured evidence, supported interpretation or an unanswered question. This presentation makes the reasoning visible instead of letting one arrow imply that all steps have been directly observed.
The same discipline helps when reading reassuring claims. A photograph of several bears, or one apparently successful hunting event, is not evidence against a regional survey. The examples describe different scales. Respecting that difference allows readers to recognize both real individual observations and population-level evidence without forcing them into a false contradiction. The survey boundary and sampling interval should therefore remain visible wherever the estimate is reused, including charts, captions and summaries.