Wind, Diesel and Heat: Reading Antarctic Station Energy Claims
Use a documented Antarctic example to evaluate percentages without mistaking rated power for year-round self-sufficiency.
Start with a documented system
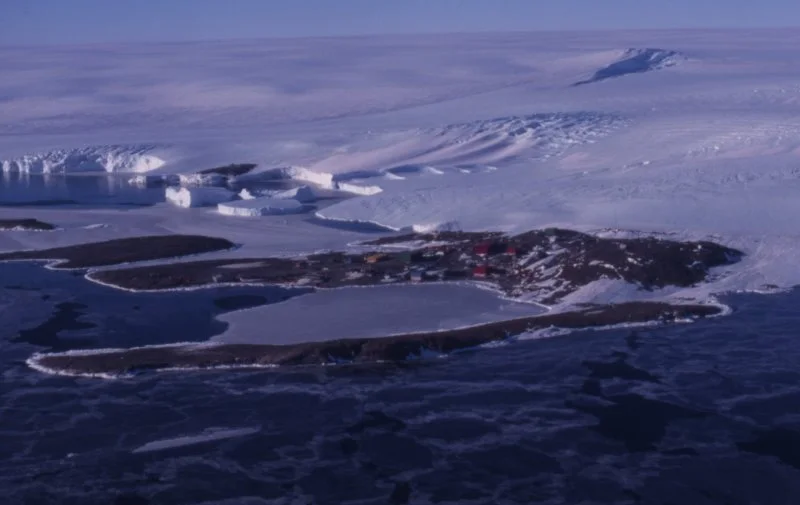
Australia's Antarctic Program documents wind generation at Mawson and diesel generation at its stations. Its wind-power account also records operational changes over time. A photograph of turbines is evidence of equipment, not of a station's annual renewable-energy share.
Our previous Qinling headline claimed a first overwinter and a 72-percent diesel reduction without a source establishing either figure. This replacement does not report new performance results from Qinling. It explains what evidence a claim of that kind would require.
Three different denominators
Installed capacity, energy produced and fuel saved measure different things. Capacity is a rated rate of output; energy is output accumulated over time. Fuel savings require a baseline describing what would otherwise have been burned. A percentage without its denominator and period cannot establish annual performance.
Heat adds another layer. A station can recover useful heat from diesel generation. Replacing some generator electricity changes an energy system that may also depend on that heat. Adding a wind turbine therefore cannot be assessed only by comparing its nameplate rating with an electrical load.
Reliability belongs in the account
Maintenance access, spare parts, icing and the availability of wind affect operation. Backup generation serves a different purpose from the renewable plant: it helps meet demand when the primary system is unavailable or insufficient. The existence of backup does not negate a renewable contribution, but neither does renewable generation eliminate the need to explain backup.
For a credible station story, look for metered electricity, useful heat, fuel consumption, the comparison year and outages. Distinguish a design target from measured operation. Those details allow readers to understand both progress and limitations without inventing a single impressive percentage.
Use Mawson as a documented example, not a substitute Qinling result
The Australian Antarctic Program documents wind generation at Mawson. Read it as a station-specific energy example: the equipment, electricity system and operating context belong to Mawson. They do not establish performance at Qinling. This is useful because a real example can explain how hybrid station systems work without allowing a number to migrate between unrelated facilities.
For any claimed percentage saving, first identify what was reduced: diesel volume, electricity from generators or total energy including heat. Then identify the comparison period and baseline. As a hypothetical calculation, saving twenty fuel units from a baseline of one hundred is twenty percent; the same saving from two hundred is ten percent. Neither value describes a measured station result. The arithmetic exposes why a percentage without its denominator is incomplete and why installed capacity alone cannot establish a year-round fuel reduction.
Use units to catch the most common mistake
Power describes a rate; energy describes an accumulated amount. A rated turbine capacity therefore cannot be compared directly with an annual fuel total as though they were the same unit. To connect them, an analysis needs operating time and actual output, along with the assumptions needed to relate useful energy to fuel use. A reader can detect the category error without needing to design the power system.
The time window matters as well. A favorable windy week does not establish the annual renewable share, just as a short outage does not prove that a system provides no useful contribution over a year. Ask for the measurement interval before deciding what the result demonstrates. A well-defined short-term measurement is valuable when presented as short-term; the problem is silently promoting it into a broader claim.
Why heat changes the comparison
Stations need energy for more than lights and instruments. Where generator waste heat is recovered for useful heating, electrical production and heat supply are connected. Reducing generator operation can therefore change both sides of the energy system. The Australian program's description of cogeneration provides a concrete reason to include heat in the explanation rather than treating it as an incidental detail.
This does not mean renewable electricity cannot reduce fuel demand. It means the account should explain how the wider system meets its needs under the new arrangement. A credible report identifies useful heat, backup operation and the periods represented by the data. It can celebrate an improvement while still explaining why a station may retain generators, spare parts and contingency arrangements.
Evaluate reliability without an all-or-nothing verdict
An Antarctic energy system must operate within a difficult logistical setting. A component's nominal capability, its availability and the ability to maintain it are separate questions. A design may be technically promising while still facing practical constraints. Conversely, the need for maintenance is not evidence that a technology has failed everywhere. Compare the actual documented operation with the claims made for it.
For a reader assessing a performance story, request a small evidence table: system description, dates, electricity, useful heat, fuel, comparison baseline and outages. Missing fields should limit the conclusion rather than invite an invented percentage. This article uses documented Australian examples to teach that approach; it makes no new claim about Qinling's measured performance and does not transfer another station's results to it.
A worked example of two different percentage claims
Consider an entirely fictional month in which a renewable plant supplies 20 units of a station's 100 units of electricity. Its electrical share is 20 percent for that defined month. That statement does not establish a 20-percent reduction in diesel, because the generators may operate differently and may also supply useful heat. Nor does it describe the annual share, because other months can have different production and demand.
Now imagine the station uses less fuel than in a reference year. To interpret the saving, ask whether occupancy, weather, electrical demand and heating requirements were similar. The comparison may still demonstrate a useful reduction, but explaining the baseline prevents readers from attributing every change to one machine. These invented quantities are accounting examples, not reported station performance.
An honest energy story can therefore contain several results: renewable electrical production, a share of a defined electrical demand, useful heat recovered and measured fuel consumption. Keeping the quantities separate is more helpful than choosing the largest percentage and calling it the station's renewable performance. Readers can then see what improved, how it was measured and what additional evidence would be needed to generalize beyond the reported period. For comparisons across stations, also identify whether accommodation, laboratories and heating are included. Different facility boundaries can make superficially similar energy percentages unsuitable for direct comparison.