The 2025 Arctic Sea-Ice Minimum: Why Tenth-Lowest Still Matters
Separate a single-year ranking from the long-term record, and learn why minimum extent is not a measure of ice thickness.
Start with the correction
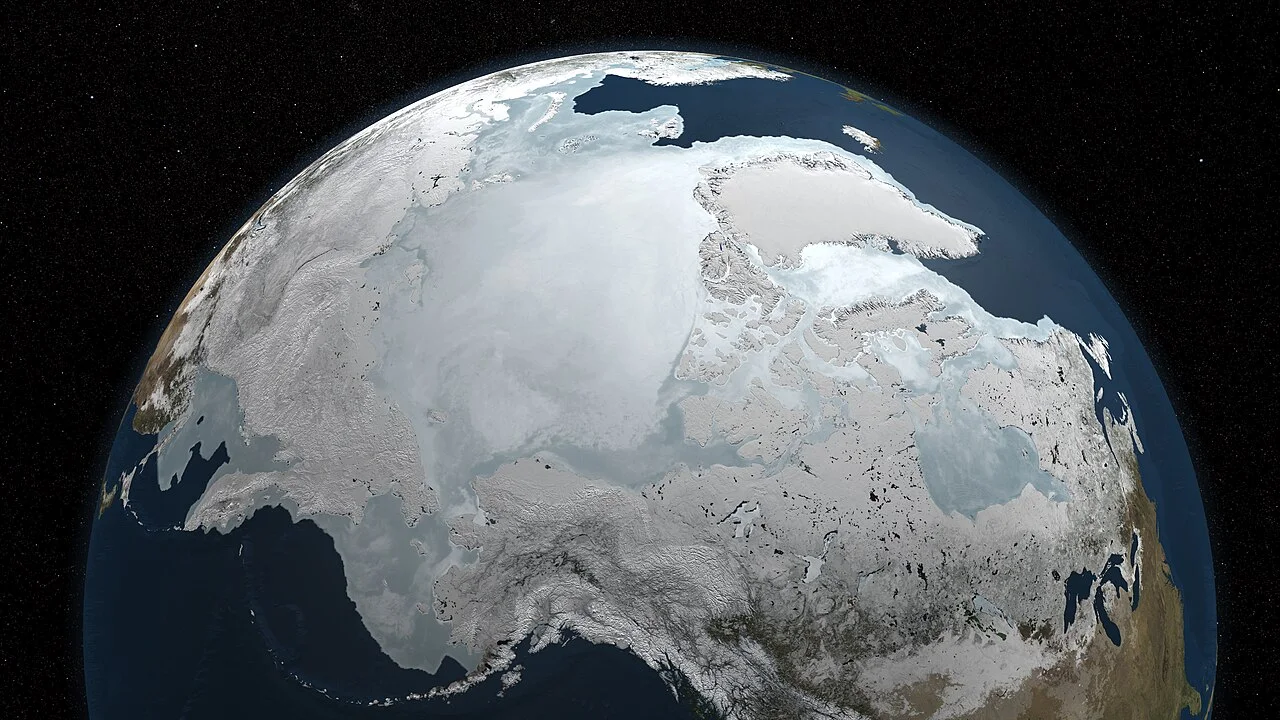
The Arctic sea-ice minimum in 2025 was not the second-lowest in the satellite record. NSIDC's September 17 announcement placed it approximately level with 2008 and 2010 in tenth position, at about 4.60 million square kilometers. That announcement described a preliminary annual minimum, not the average ice coverage for the whole month. Our earlier headline gave the wrong ranking; the distinction matters because a compelling climate story still needs the right measurement.
A useful reading sequence is to identify the variable, its date and its reference period before interpreting the headline. In this case the variable is extent: the combined area of grid cells meeting an ice-concentration threshold. It is not the exposed area of individual ice floes, the amount of frozen water or the thickness of the remaining pack.
Rank, trend and uncertainty answer different questions
A rank compares one annual minimum with other annual minima. A trend asks how the series changes over decades. A year can rank above several recent years while remaining low relative to much of the earlier record. NSIDC noted that the 19 years from 2007 through 2025 occupied the 19 lowest positions. Calling tenth place a return to the earlier climate would therefore confuse relative rank with recovery.
Small differences also deserve proportionate language. NSIDC treats very similar minimum values as tied rather than pretending that the available measurement supports an exact sporting league table. Published near-real-time values can change during final processing. When quoting a number, keep the source's date and its preliminary or final label beside it.
What the number cannot tell a traveler
A basin-wide minimum is a climate indicator, not a local travel forecast. Two ice packs with the same extent can differ in thickness, concentration, age and distribution. A low total does not imply a continuous open-water corridor beside a particular coast. Nor does it describe the condition of a single floe where animals rest or people travel.
To compare years yourself, use the same NSIDC series and the same seasonal statistic. Do not compare a daily minimum with a September monthly mean, or mix extent with area. Then ask a second question: what complementary observations would be needed? Thickness, regional concentration and weather can add context, but they cannot be reconstructed from this one number alone. This article interprets the dated 2025 announcement; it is not a live sea-ice bulletin.
A small grid example clarifies extent and area
Imagine a deliberately simplified map with four equally sized ocean cells. One contains dense ice, another is half ice and half water, a third contains scattered floes, and the fourth is open water. An extent calculation counts cells that meet its specified concentration criterion; an area calculation weights the ice-covered fraction. Both are legitimate measurements, but they summarize different properties. The example is illustrative, not a reconstruction of NSIDC's processing algorithm or a source of substitute observations.
Now imagine wind spreading the same floes over a larger surface. Their arrangement can change even if the amount of frozen water changes little. Conversely, compacting the floes can reduce their footprint. This is why an extent curve should not be described casually as the volume of ice left. A strong explanation names the quantity before discussing what environmental processes may have affected it.
Build a fair year-to-year comparison
Suppose you find one website announcing the lowest daily extent in September and another displaying the average for September. Do not subtract those figures and call the difference a discrepancy between scientists. An average includes days before and after the minimum, when extent may have been greater. First locate matching statistics from the same record, then compare their definitions and processing status. Most apparent contradictions become much easier to evaluate once the comparison is like-for-like.
Next examine the comparison window. A line fitted across the full satellite era and a line fitted across a recent subset answer different questions. The 2025 NSIDC announcement itself distinguishes the long-term decline from the much flatter recent September-minimum series. Neither observation cancels the other. A short interval can be influenced strongly by variability; the full record can reveal a shift that is difficult to see by comparing only neighboring recent years.
Choose evidence that matches your actual question
For a school assignment about climate, the annual minimum can be an appropriate starting indicator, provided the assignment also discusses its definition and longer record. For a question about a coastal community, begin with regional observations and the knowledge relevant to that location. For a shipping decision, use current operational ice information and professional procedures. These readers do not need competing versions of the same headline; they need different evidence because their decisions are different.
An animal-habitat question introduces another distinction. A species can depend on ice at a particular season or location rather than on the lowest basin-wide total. The annual minimum alone cannot establish whether a breeding platform persisted or a hunting area remained accessible. Treating it as context rather than a universal ecological verdict helps the reader connect climate indicators with biology without pretending that one graph measures every consequence.
Read the actual NSIDC announcement in three steps
Open NSIDC's September 17, 2025 announcement and locate its opening result. The reported event is the likely annual minimum on September 10, not the September monthly average. Next, read the comparison: 4.60 million square kilometers shares tenth place with 2008 and 2010. The correct answer to was this a new record low is no. Neither the article's publication day nor a tenth-place rank changes the measurement into a different statistic.
Now read the time window attached to the trend statement. NSIDC reports no significant trend in September minima over 2007–2025, while those years occupy the lowest nineteen positions in the longer satellite record. These statements address different comparisons and can both hold. For a classroom summary, keep the event date, extent, ranking and trend window in separate fields. The diagram below preserves those fields rather than inventing annual values between them.
Keep a short evidence note
A compact note can contain the product name, statistic, observation date, announcement date and a sentence explaining its limits. Keeping those fields together makes a chart reusable in a classroom or reading group. It also exposes the exact point where a headline moves from measured information to interpretation, allowing readers to discuss that interpretation rather than argue about numbers drawn from incompatible products.