The Antarctic Circumpolar Current: Flow Is More Than a Big Number
Read a transport estimate, a map and an ocean-temperature claim as different pieces of evidence.
A route around a continent
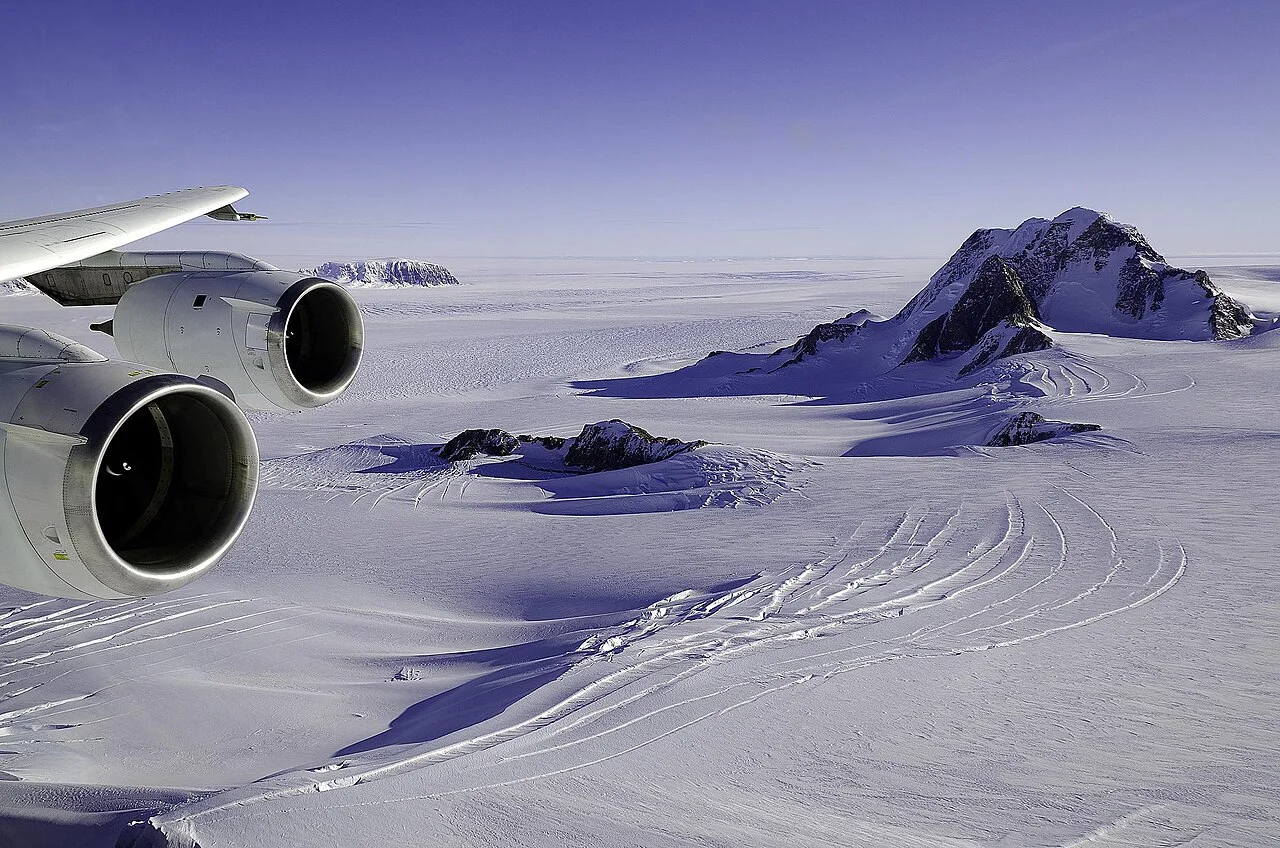
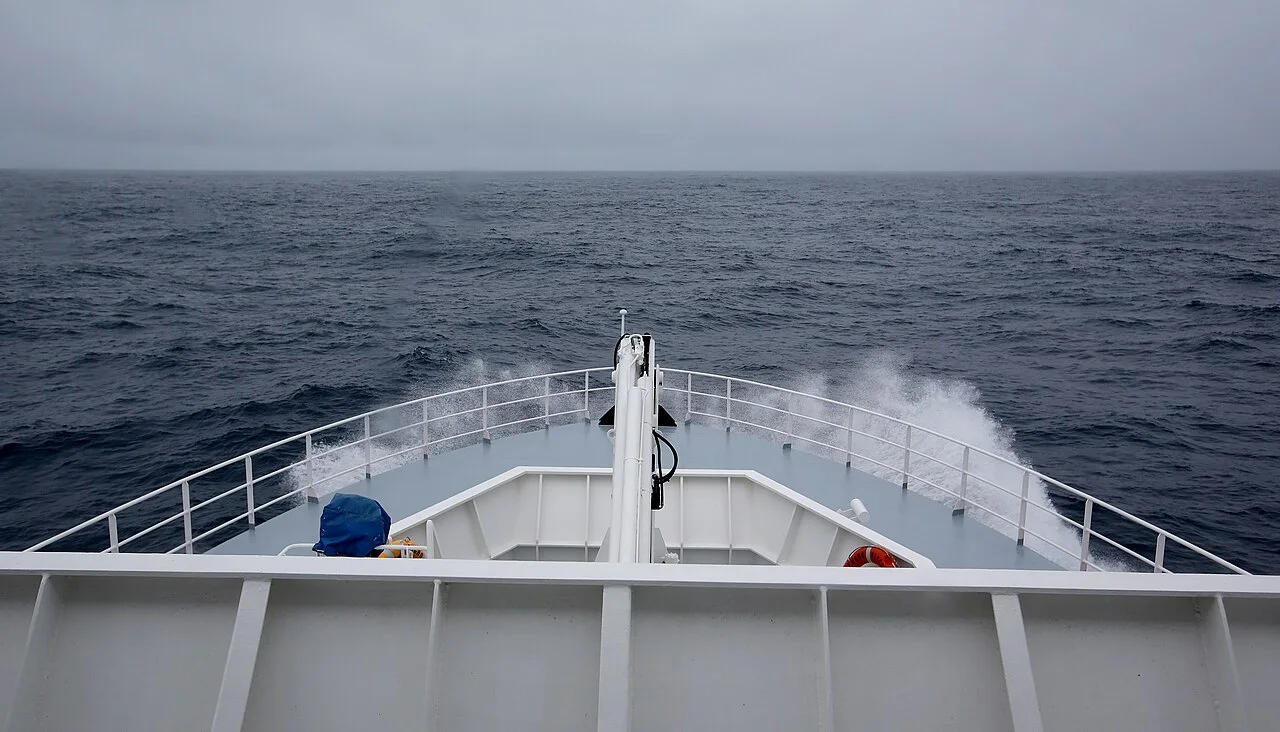
The Antarctic Circumpolar Current flows around Antarctica through the connected Southern Ocean. Its setting differs from an ocean current blocked by continents at the same latitude. It connects ocean basins and is part of a wider system involving winds, density differences, mixing and the shape of the seafloor.
A simple arrow around Antarctica is a useful orientation aid, but the actual current is not a uniform ribbon with identical speed from surface to bottom.
What a transport unit tells you
Ocean transport describes water crossing a defined section over time. A Sverdrup is one million cubic meters per second. A large transport number is therefore not a speed in kilometers per hour, nor does it say how warm that water is. To interpret an estimate, identify the section, depths, dates and method.
Our earlier presentation of a single fixed value as though it were the current's universal constant obscured those choices. Different observational and analytical approaches can give different estimates without measuring an entirely different ocean.
An influence is not a perfect barrier
The current and associated fronts help organize exchanges around Antarctica, but calling them an impenetrable wall is misleading. Heat can reach continental margins through specific pathways. A broad circumpolar map cannot establish which pathway delivered heat to an individual glacier.
For a glacier-impact claim, look for evidence connecting offshore water, shelf circulation and ice interaction. For a current-strength claim, look for a defined transport or velocity measurement. Keeping these questions separate makes a Southern Ocean story more useful than one that treats strongest current, fastest flow and greatest warming as synonyms.
Translate transport before comparing it
Transport combines the water moving through a section across its width and depth. In a deliberately uniform imaginary section, multiplying cross-sectional area by speed gives a volume per time. An area of two square meters with water crossing at one meter per second would produce two cubic meters per second. Real ocean sections are not uniform, so measurements and analysis must account for spatial variation.
This arithmetic explains why a current can carry a large volume without every parcel moving at an exceptional speed. A wider or deeper section can contribute to the total. When an article offers a transport value, keep the location and the integration boundaries with it. Without them, a large number sounds impressive while leaving the reader unable to say what was actually estimated.
Speed, direction and heat answer different questions
Velocity describes motion with direction; volume transport summarizes flow through a boundary; heat transport adds information about temperature and the chosen reference and accounting method. A change in one quantity does not automatically specify the others. The terms should remain separate even when a study examines their connections. A warm patch on a map is not a direct measurement of total current transport.
For a fictional example, compare a narrow, faster flow with a broad, slower flow. Without their dimensions and vertical structure, the speed comparison cannot establish which carries more water. Add differing temperatures and the heat question becomes another calculation. This exercise helps readers see why strongest, fastest and warmest should not be used interchangeably in an ocean headline.
A map flattens a three-dimensional system
A surface arrow summarizes orientation, but ocean properties vary with depth and position. Ask whether a map depicts surface velocity, an average over depth or a conceptual pathway. The caption should state the choice. A line representing a front or boundary is also a summary rather than an impermeable fence through which nothing can pass.
Look for cross-sections or descriptions of the vertical structure when the argument concerns subsurface water. If the study connects offshore conditions with an Antarctic margin, identify the actual pathway and supporting observations. A circumpolar overview can locate the setting, but it cannot independently establish the route by which heat reached the underside of a particular shelf. That connection needs evidence at the relevant scale.
Compare estimates by method and interval
Two transport estimates may differ because they cover different periods, sections, depths or analytical assumptions. Before deciding that the current changed, check whether those choices are comparable. A time series produced through a consistent method supports a different comparison from two isolated values assembled from unrelated studies. Uncertainty ranges also belong beside the estimates rather than being dropped for a cleaner headline.
This does not mean every difference is methodological. It means the interpretation should test the possibilities in a sensible order. A useful report explains how the estimate was produced and why its comparison is meaningful. If the studies answer different questions, state the difference instead of forcing their numbers into a trend that neither was designed to measure.
Follow a glacier-impact argument through its links
The claim that an ocean change affected a glacier needs more than a current's name. Identify the offshore observation, the shelf-water connection, the ice interaction and the measured or modeled response. Some papers may focus on only one link and draw on other research for the rest. An accessible synthesis should show those sources rather than imply that one broad map measured the entire chain.
After reading, try completing two separate sentences: the study estimated this kind of flow through this boundary, and the glacier argument depends on this additional connection. If those sentences require different evidence, keep both. The result is a useful explanation of a major Southern Ocean circulation system whose volume, structure and environmental effects can be investigated without reducing it to one supposedly permanent number.
Use NOAA's current definition before comparing transport
NOAA describes currents as water movement driven by influences including wind and density differences. Begin with that physical movement, then specify the boundary through which transport is being estimated. A broad arrow around Antarctica is useful orientation, but it does not define the width, depth or velocity structure required for a volume calculation.
As a worked reading task, label an imaginary section with area and perpendicular speed. Multiplication gives volume per time; changing either input changes the result. For an actual Southern Ocean estimate, find how the study sampled or inferred those inputs rather than assuming uniform flow. A temperature claim then requires additional thermal information. This separates the questions a reader might ask about a current: where water goes, how fast it moves, how much crosses a boundary and how heat is carried. One impressive number cannot answer all four.